
Preparing for the RBT exam and want to check how well you understand data collection, measurement systems, and graph interpretation? This Data Collection and Graphing Quiz includes 13 realistic, exam style questions aligned with the BACB RBT Task List 3.0.
Accurate data collection is one of the most important responsibilities for an RBT. Knowing how to record behavior correctly and read a line graph can make a major difference in treatment decisions. This quiz gives you a practical way to review all of those concepts in one place.
Strong data-collection skills help an RBT record behavior the same way every session. Consistency is what allows BCBAs to make correct treatment decisions. When you practice with structured quiz questions, you learn how to pick the right measurement method for different behaviors, whether the goal is to track how often something happens, how long it lasts, or whether it occurs during specific intervals. This improves both your exam performance and your confidence during real client sessions.
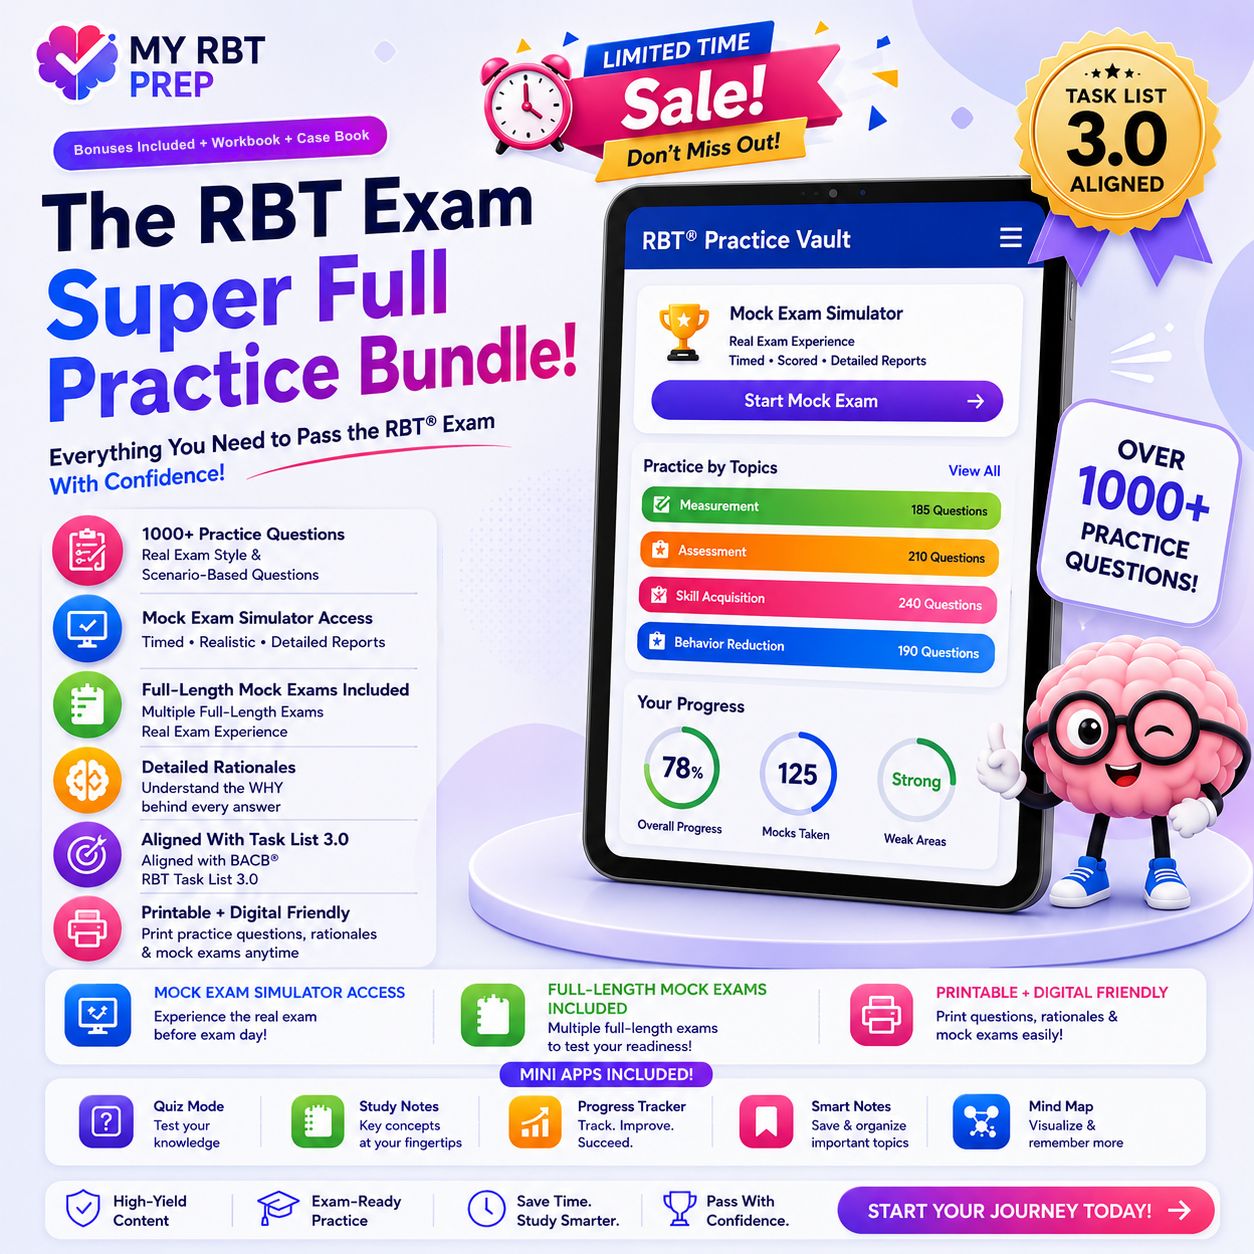
Pass Your RBT® Exam on the First Attempt
Practice with 1,000+ realistic scenario questions, multiple full-length timed mock exams, and detailed rationales formatted exactly like the real Pearson VUE test.
Quiz Complete!
Short free quizzes only scratch the surface. Passing the actual 85-question Pearson test requires building your pacing and stamina with full practice.
- Only 6 sample questions
- No timed exam simulator
- No detailed rationales
- Cannot test full pacing
- Multiple Full Mocks (85Q)
- 1,000+ realistic scenario questions
- Step-by-step rationales
- Full app access + printable PDFs
You've completed 5 questions. You have 1 final sample question before the free preview ends.
- 🎯Multiple Full-Length Timed Mocks — exactly like the real Pearson VUE exam
- 📋1,000+ Practice Questions — covering all 2026 BACB Task List 3.0 tasks
- 🧠Detailed Rationales — learn why right answers work and avoid traps
- 📱Exam Simulator App Access — practice anytime on your phone or laptop
You've completed your 6 free sample questions. The real test is 85 questions long with tricky scenarios. Get full practice now so nothing surprises you on test day.
- Multiple Full-Length Timed Mocks — practice with real 85-question exams timed like Pearson VUE
- 1,000+ Scenario Questions — master real clinical situations across all 6 BACB domains
- Crystal-Clear Explanations — understand exactly why each answer is right and how to avoid trick choices
- Full Simulator App + Printable PDFs — practice on your phone in bed or print worksheets
- Complete Exam Prep Materials — build your pacing, endurance, and exam readiness on your schedule
Most candidates who fail admit they only practiced short free quizzes. Give yourself the best chance to pass on your very first try.
RBT Data Collection and Graphing Study Guide | Task List 3.0
It’s designed to help you spot weak areas and strengthen the skills you’ll use during real ABA sessions and practice realistic exam-style question tests.
Why Graph Interpretation Matters in ABA?
Graphs are the clearest way to show whether a client is improving or regressing. Understanding trends, levels, stability, and phase changes helps you report progress accurately to your supervisor. Many new RBTs struggle with reading line graphs because they focus only on the data points instead of the pattern. These quiz questions help you build that skill step by step, so graph interpretation becomes something you can do quickly and confidently.
What You’ll Strengthen in This Quiz?
-
Using continuous measurement systems
(frequency, rate, duration, latency, IRT) -
Choosing the right discontinuous measurement method
(partial interval, whole interval, momentary time sampling) Active Recall Study System
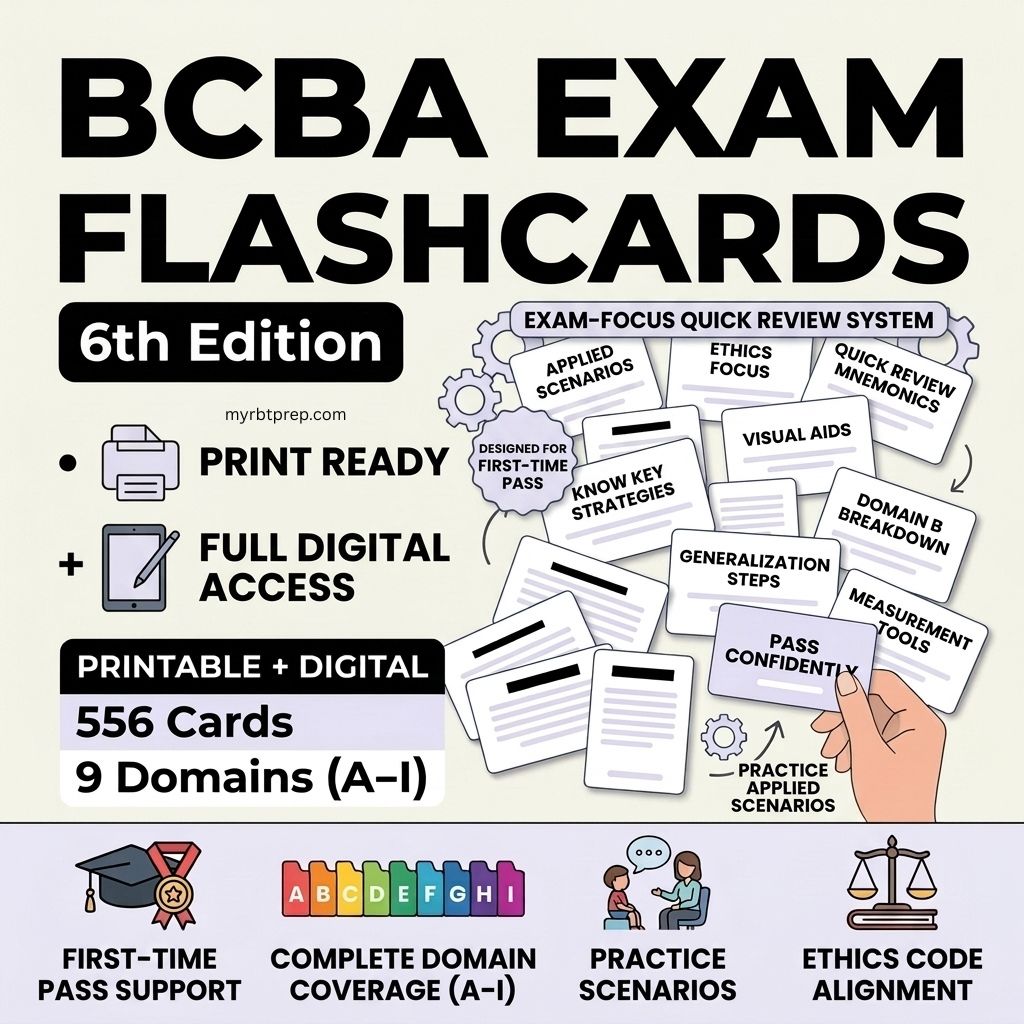
RBT® Exam Flashcards & Study App (3rd Edition)
Master essential ABA terminology and clinical discrimination across all 6 BACB task list areas with 500+ printable and digital flashcards, real exam cues, and full mobile app access.
Get Flashcards & App Access → ⚡ Master Key Terms & Definitions Fast -
Knowing when permanent-product recording is appropriate
-
Interpreting line graphs, data paths, trends, and variability
-
Understanding phase changes and progress patterns
-
Avoiding common data-collection errors and drift
-
Applying Task List 3.0 terms to real ABA scenarios
The scenarios in this quiz reflect the same situations you’ll see in clinics, homes, and schools. You’ll practice recognizing what kind of data a BCBA expects from you and how to record it without drifting from the protocol. This is a core part of ethical ABA practice and something employers look for when hiring RBTs. The more you work with measurement scenarios, the more natural data collection becomes during live sessions.
Short, consistent practice is one of the best ways to prepare for the RBT exam. This quiz fits easily into a daily study plan, allowing you to review essential measurement terms, correct your mistakes, and slowly build mastery. Whether you’re studying early in the morning or between shifts, these questions help reinforce the skills you need to pass confidently.
Core Study Guide: Measurement & Data Collection (Task List 3.0)
Accurate measurement is the cornerstone of Applied Behavior Analysis. As a Registered Behavior Technician (RBT), the data you collect directly dictates whether a Board Certified Behavior Analyst (BCBA) continues, modifies, or fades an intervention. The BACB Task List 3.0 emphasizes mastering both continuous and discontinuous measurement systems, permanent product recording, and visual graph analysis.
1. Continuous vs. Discontinuous Measurement
Continuous measurement captures every single occurrence of a target behavior throughout an observation period:
- Frequency / Count: The total number of times a behavior occurs (e.g., 5 hand-raises in 30 minutes).
- Duration: The total length of time a behavior lasts from onset to offset (e.g., a tantrum lasting 12 minutes).
- Latency: The elapsed time between the presentation of a stimulus (SD) and the initiation of the response (e.g., 4 seconds between instruction “sit down” and the client moving toward the chair).
- Inter-Response Time (IRT): The time that elapses between two consecutive instances of the same response (e.g., 18 seconds between bites of food).
Discontinuous measurement samples behavior during intervals rather than tracking every instance:
- Partial-Interval Recording: The behavior is marked if it occurs at any moment during the interval. It systematically overestimates behavior, making it ideal for tracking target behaviors targeted for reduction (like self-injurious behavior or vocal outbursts).
- Whole-Interval Recording: The behavior is marked only if it persists throughout the entire duration of the interval. It systematically underestimates behavior, making it best for behaviors you want to increase (such as sustained task engagement or cooperative play).
- Momentary Time Sampling: The behavior is recorded only if it is occurring at the exact moment the interval ends. Highly practical for busy classroom or clinic environments with multiple learners.
2. Permanent Product & Line Graph Analysis
Permanent product recording measures behavior by its lasting concrete impact on the physical environment without requiring direct observation (e.g., counting completed puzzle pieces or graded test sheets). On the RBT exam, always verify whether you need to observe the behavior directly or simply evaluate the end result.
When analyzing ABA line graphs, remember the primary visual dimensions: the horizontal X-axis (abscissa) represents time, dates, or consecutive sessions, while the vertical Y-axis (ordinate) plots the quantitative behavioral measurement. A solid vertical line indicates a phase change line (such as introducing a new prompt hierarchy or fading reinforcement), separating baseline from active treatment.

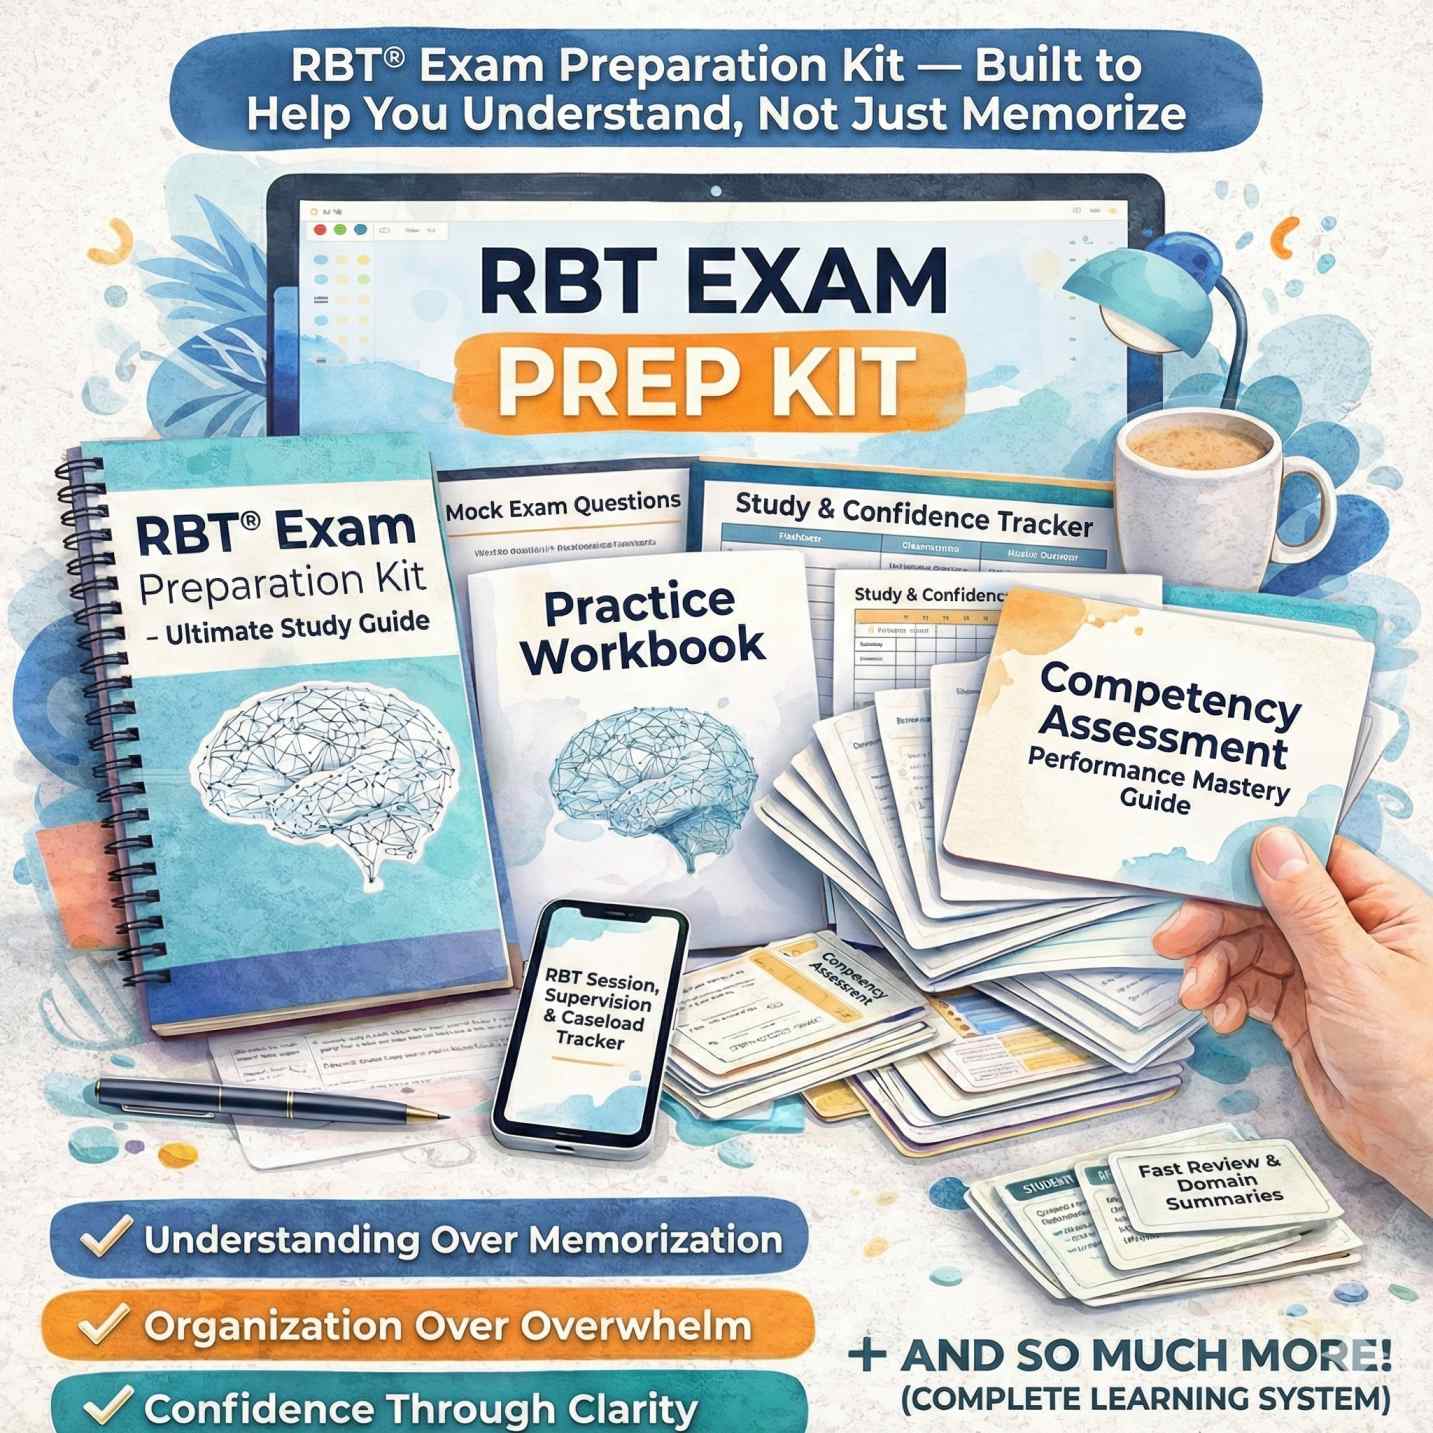
Everything You Need to Pass Your RBT® Exam
Study with our complete, all-in-one preparation package covering every task on the BACB Task List 3.0:
- 1,000+ Practice Questions & Timed Simulator
- 3rd Edition Task List Study Guide & Workbook
- Active Recall Flashcards System + Mobile App
- 20-Task Competency Assessment Mastery Guide