
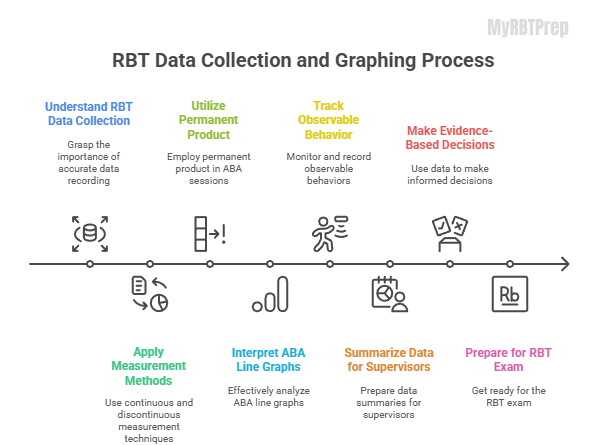
By learning these skills, you can track observable and measurable behavior, summarize data for supervisors, and make evidence-based decisions. This guide prepares you for real-world ABA sessions and the RBT mock exam practice, ensuring high-quality, ethical practice.
Accurate and consistent data collection is one of the most important responsibilities of a Registered Behavior Technician (RBT). Data is what allows a BCBA to identify patterns, verify whether an intervention is working, and make ethical decisions about treatment. Without reliable measurement, the team is essentially “guessing,” which can compromise progress and negatively affect client outcomes.
This expanded study guide covers the updated Unit A tasks from the 2026 Task List 3.0. You’ll learn essential measurement systems, how to graph and summarize data, and how to ensure the information you collect is objective and trustworthy. If you’re preparing for the RBT exam or strengthening your clinical skills, this guide provides a clear and comprehensive breakdown of everything you need.
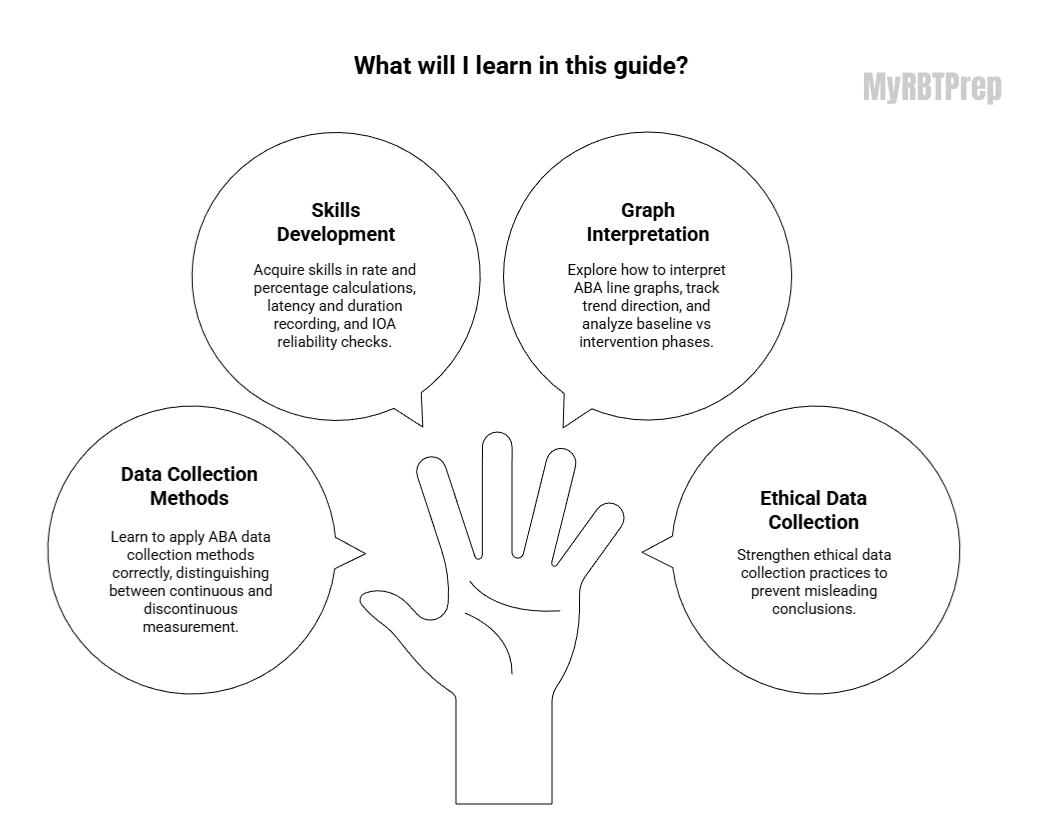
What You’ll Learn in This Guide
By the end of this study guide, you’ll understand how to:
- Select and implement measurement systems that match the behavior being monitored, including continuous methods (frequency, duration, rate, latency, IRT) and discontinuous methods (whole-interval, partial-interval, momentary time sampling).
- Record permanent products when the behavior leaves a measurable outcome that can be reviewed after the session.
- Accurately enter data into systems, plot graphs, and interpret levels, trends, and variability in behavior.
- Write clear and objective operational definitions that describe behavior in observable terms rather than assumptions.
- Calculate common ABA metrics such as rate, mean duration, and percent correctness.
- Identify risks associated with poor data quality, procedural drift, and unreliable measurement.
- Review updates from Task List 2.0 → Task List 3.0.
| Skill Area | What You Will Be Able to Do |
|---|---|
| Measurement Selection | Choose continuous vs. discontinuous systems appropriately |
| Data Recording | Collect frequency, rate, duration, latency, and IRT accurately |
| Graphing | Plot and update ABA graphs correctly |
| Behavior Description | Write objective operational definitions |
| Data Analysis | Identify level, trend, and variability |
| Ethics & Fidelity | Recognize risks of poor data quality |
This guide concludes with next-step recommendations, including where to take the RBT Data Collection & Graphing Quiz (2026).
Key Terms for RBT Data Collection (Overview)
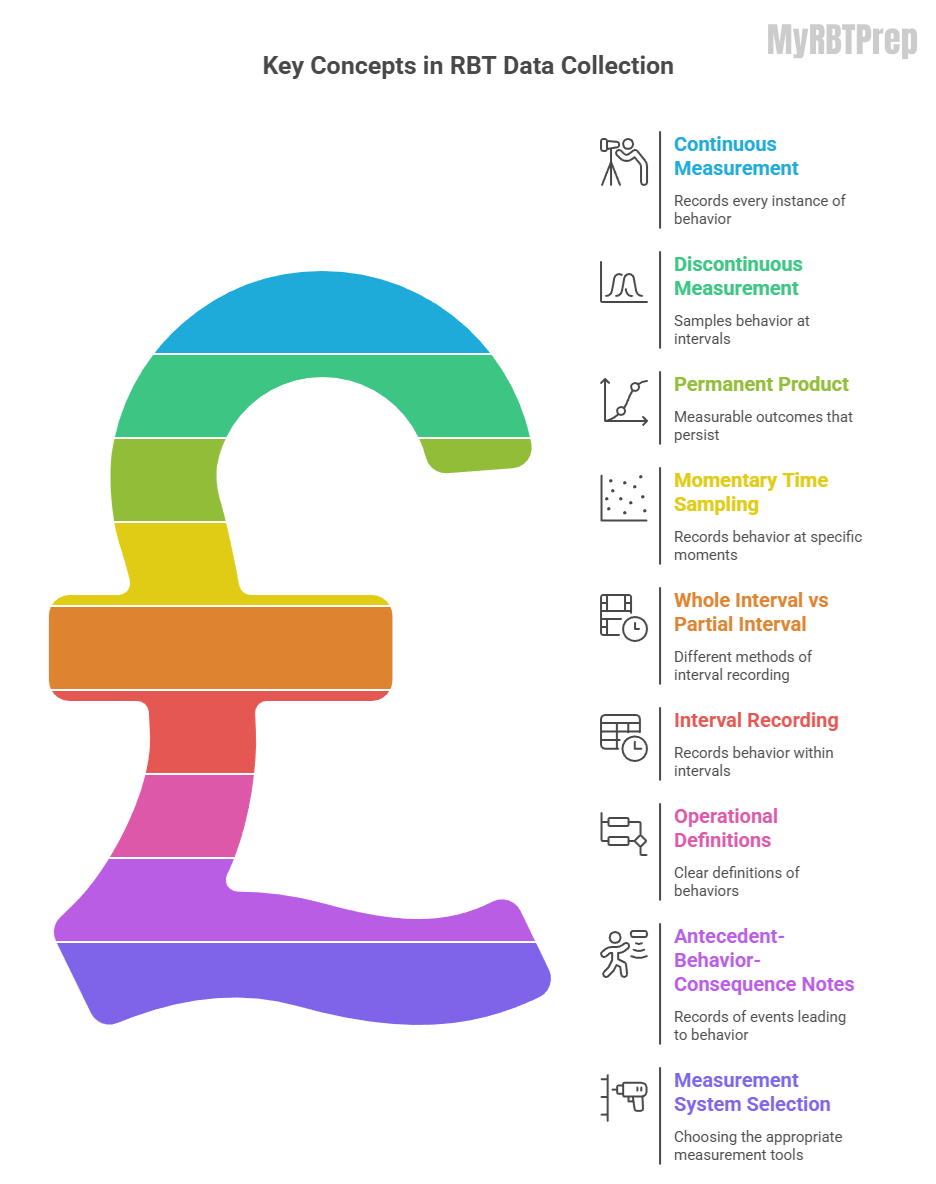
Before diving into each task item, review these essential measurement terms:
- Continuous measurement: Captures every occurrence of the behavior during observation.
- Discontinuous measurement: Samples behavior during specific intervals or moments in time.
- Frequency: The count or number of times a behavior occurs.
- Rate: Frequency divided by the time observed (responses per minute/hour/session).
- Duration: How long a behavior lasts from start to finish.
- Latency: Time from a cue, SD, or instruction to the start of the behavior.
- Interresponse Time (IRT): Time between the end of one response and the beginning of the next.
- Whole-Interval Recording: Behavior must occur for the entire interval to count.
- Partial-Interval Recording: Behavior counts if it occurs at any point in the interval.
- Momentary Time Sampling (MTS): Observer checks only at the end of an interval.
- Permanent Product: A lasting result of behavior that can be measured after it has occurred.
- Interobserver Agreement (IOA): How closely two observers’ data match, used to evaluate reliability.
| Term | Simple Definition | Example |
|---|---|---|
| Frequency | Number of times behavior occurs | 10 hits in a session |
| Rate | Frequency divided by time | 5 responses/min |
| Duration | How long behavior lasts | Tantrum lasted 4 minutes |
| Latency | Time from SD to behavior | 8 seconds to comply |
| IRT | Time between responses | 15 seconds between claps |
| Permanent Product | Behavior outcome that remains | Completed worksheet |
| IOA | Agreement between observers | 90% agreement |
Understanding these terms will make the rest of the guide easier to digest.
Prepare the right way, before your competency assessment.
A.1 – Implement Continuous Measurement Procedures
Continuous measurement tracks every behavior and helps record event recording with precise timing. You calculate rate and percentage calculations ABA, record latency and duration, and use tally/count data ABA for immediate behaviors.


These methods prevent missed behaviors and provide a full picture of client progress monitoring.
Discontinuous measurement uses time-based sampling like whole interval vs partial interval and momentary time sampling ABA.

These methods are ideal for high-rate behaviors or busy sessions. Understanding when to use continuous vs discontinuous measurement prevents measurement reliability problems and common data collection pitfalls ABA.
|
Frequency (Count)
Frequency is the simplest continuous measure: it tells you how many times a behavior occurred.
Example:
You tally every time a child greets a peer during recess. If you mark down 11 greetings, the frequency is 11.
Frequency works best for discrete behaviors—responses that have a clear start and stop (e.g., taps, jumps, requests, hits).
Rate
Rate corrects for the problem of different observation lengths. It tells the team how often behavior happens relative to time.
Example:
A student raises their hand 15 times across a 45-minute lesson.
Rate = 15 ÷ 45 minutes → 0.33 hand raises/min
Rate is especially useful when time periods change from session to session.
Duration
Duration measures how long the behavior continues once it has begun.
Example:
During a reading activity, a learner remains engaged for 12 minutes before stopping.
Duration is typically used for behaviors that vary widely in length, such as tantrums, sitting, playing, or crying.
Latency
Latency measures the time between a cue and the start of the behavior.
Example:
After being told “Start your worksheet,” a learner begins after 10 seconds.
Latency = 10 seconds.
Latency is useful for behaviors that follow specific instructions or prompts.
Interresponse Time (IRT)
IRT is the time between two responses.
Example:
A child finishes one teeth-brushing step and starts the next 20 seconds later.
IRT = 20 seconds.
IRT is often used for repetitive behaviors or self-stimulatory behavior.
Common errors with continuous measurement:
- Not defining the behavior clearly (leading to inconsistent recording).
- Forgetting to start or stop the timer.
- Allowing environmental distractions to interrupt timing.
- Recording frequency when duration would be more meaningful (or vice versa).
Exam Reminders:
- Frequency = count
- Duration, latency, IRT = timing
- Rate = count ÷ time
- Continuous measurement → captures every occurrence
| Method | Measures | Best Used When |
|---|---|---|
| Frequency | Count of responses | Discrete behaviors |
| Rate | Responses per unit of time | Sessions vary in length |
| Duration | Length of behavior | Behavior varies in time |
| Latency | Delay before behavior starts | Following instructions |
| IRT | Time between responses | Repetitive behaviors |
A.2 – Implement Discontinuous Measurement Procedures
Permanent-product measurement focuses on outcomes rather than live behavior. You track items like completed worksheets, cleaned areas, or completed tasks. These measures provide clear response measurement and reduce the need for live observation. Using permanent product in ABA improves efficiency and accuracy.
Permanent products have limits. They may not show process quality or behavior topography. Using these correctly avoids measurement errors and risk. They are ideal when results persist and are easy to quantify. Understanding ethical data collection ABA and correct scoring ensures your records reflect real behavior.
Discontinuous methods collect data by sampling behavior instead of capturing every instance. They are useful in settings where observing continuously is impractical—such as classrooms, busy homes, or sessions with numerous competing responsibilities.
Whole-Interval Recording
You score “yes” only if the behavior occurs during the entire interval.
Example:
If the interval is 20 seconds and the learner is on-task for only 18 of those seconds, you record “no.”
This often underestimates behavior because the learner must meet a strict requirement.
Partial-Interval Recording
You mark “yes” if the behavior occurs at any time during the interval.
Example:
If the learner engages in yelling for just one second of a 30-second interval, it still counts.
This method often overestimates the behavior.
Momentary Time Sampling (MTS)
You observe the learner only at the end of the interval.
Example:
Every 60 seconds, you look up. If the learner is sitting, you record “yes.”
This is especially useful when observing continuously would be too demanding.
Common errors with discontinuous measurement:
- Changing interval lengths mid-session (ruins measurement validity).
- Watching the learner continuously during MTS (turns it into partial interval).
- Using discontinuous methods when continuous data is required.
Exam Reminders:
- Whole interval = entire interval
- Partial interval = any time in interval
- MTS = at the moment interval ends
- Intervals must be consistent and predetermined
- Sampling strategies estimate behavior; they do not capture all occurrences
| Method | Scored “Yes” When | Tends to |
|---|---|---|
| Whole Interval | Behavior occurs entire interval | Underestimate behavior |
| Partial Interval | Behavior occurs at any point | Overestimate behavior |
| MTS | Behavior occurring at interval end | Approximate behavior |
A.3 – Implement Permanent-Product Recording
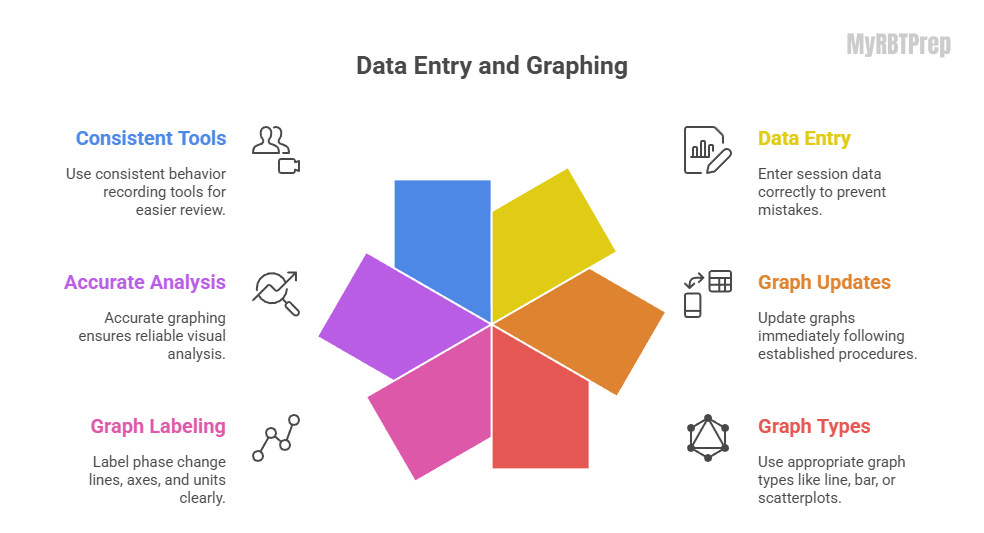
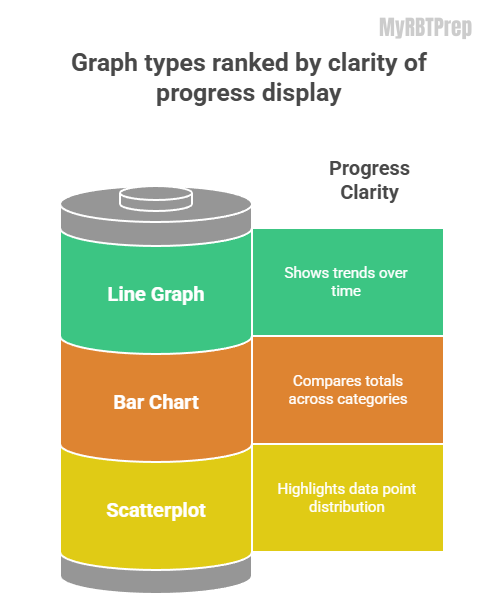
Proper session data entry prevents mistakes. Update graphs immediately and follow graph update procedures. Use ABA line graphs, bar graphs, scatterplots, or cumulative charts. Label phase change lines, axes, and units clearly. This ensures visual analysis ABA is accurate.
Incorrect graphing can hide trend direction, level shifts, or variability descriptions. Proper graphing supports data-based intervention adjustments. Consistent use of behavior recording tools makes session review easier and improves measurement reliability.
Permanent products are outcomes that remain after the behavior. They allow RBTs to measure behavior without directly observing it.
Examples of permanent products:
- Number of completed worksheets
- Whether a chore has been finished (e.g., trash taken out)
- Amount of food eaten from a plate
- Number of items assembled or constructed
- Number of errors on a writing assignment
Permanent products are useful when:
- The behavior leaves a physical trace
- You cannot be present during the behavior
- You want to measure accuracy or completion
Common errors with permanent products:
- Assuming the client produced the product (siblings or parents may help)
- Forgetting to define what counts as “complete” or “correct”
- Not recording opportunities needed for percentage calculations
Exam Reminders:
- Use permanent products when the result persists after the behavior
- Define accuracy criteria (e.g., “80% correct across 20 problems”)
- Permanent product ≠ live observation
| Behavior Area | Example Product |
|---|---|
| Academic | Completed worksheets |
| Self-help | Brushed teeth checklist |
| Household | Trash taken out |
| Writing | Number of spelling errors |
| Construction | Items assembled |
A.4 – Enter Data and Update Graphs
Once the session ends, accurate and timely data entry is essential. Behavior analysts rely heavily on visual analysis, and graphs are the quickest way to see progress.
Understanding Line Graph Components
X-axis (horizontal):
Represents time—such as sessions, days, weeks, or dates.
Y-axis (vertical):
Represents the measurement—rate, frequency, duration, percentage, etc.
Data points:
Each point shows the numerical value for one session.
Lines:
Connecting the dots helps show trends over time.
Why Graphs Matter
Graphs allow BCBAs to:
- Spot increases or decreases in behavior
- Identify variability
- Observe immediate or delayed effects of interventions
- Track improvements or regression
For example, if a child’s aggression rate drops from 6 responses/hour to 1 response/hour after a reinforcement intervention begins, graphs easily demonstrate this change.
Common graphing errors:
- Mixing measurement types (e.g., some points are frequency, others are rate)
- Forgetting to mark phase changes (baseline vs. intervention)
- Entering data days later, increasing the risk of mistakes
Exam Reminders:
- Baseline = before treatment
- Intervention = during/after treatment
- Graphs must be clear, labeled, and consistent
| Component | What It Shows |
|---|---|
| X-Axis | Time (sessions, days, dates) |
| Y-Axis | Measurement (rate, duration, %) |
| Data Points | Session values |
| Phase Lines | Baseline vs intervention |
A.5 – Describe Behavior and Environment in Observable and Measurable Terms
Writing operational definition examples ensures observable and measurable behavior. Avoid vague terms like “angry” or “naughty” and focus on precise actions. Include behavior topography, context, and clear start/stop criteria.
Use antecedent-behavior-consequence notes to capture environmental context. This allows supervisors to understand triggers and outcomes. Accurate descriptions prevent observer bias and maintain procedural fidelity in ABA. Clear recording enhances ethical data collection ABA and supports evidence-based ABA practice.
| Subjective (Avoid) | Objective (Use Instead) |
|---|---|
| “Angry” | Yelled and hit desk |
| “Defiant” | Refused instruction for 2 minutes |
| “Anxious” | Fidgeted and avoided eye contact |
Operational Definitions, ABC Notes, and Errors
Avoid interpretation or assumptions. Always record observable and measurable behavior. This reduces errors, supports fidelity monitoring, and ensures accurate data summarization for ABA.
Objective descriptions are a cornerstone of ABA. Your notes should describe exactly what you saw and heard—nothing more.
Avoid subjective language:
- “She was anxious”
- “He acted defiant”
- “They were being dramatic”
These terms are interpretations, not observations.
Write objective descriptions instead:
- “She avoided eye contact and fidgeted with her sleeves for 30 seconds.”
- “He walked away from the teacher, lay on the floor, and refused to stand up for two minutes.”
- “They yelled ‘No!’ and pushed the worksheet off the table.”
Include:
- Topography – What the behavior looks like
- Context – What was happening in the environment
- Clear start/stop points – When the behavior begins and ends
Use the Dead Man’s Test
If a dead man can do it, it’s not behavior.
Examples of “non-behaviors”:
- “Being quiet”
- “Not running away”
- “Staying still”
Instead, target observable actions:
- “Raising hand before talking”
- “Walking beside caregiver within 3 feet”
A.6 – Calculate and Summarize Data
Learn rate and percentage calculations ABA, calculate mean duration, and track session-by-session tracking. Compute interobserver agreement (IOA) reliability to ensure consistent measurement reliability. Summarize data for supervisors to support behavior reduction programs and skill acquisition tracking.
Summarizing data allows clear client progress monitoring. Use summarized data sets to spot trends or anomalies. Accurate math prevents measurement errors and risk. Proper summaries guide data-based intervention adjustments and enhance treatment integrity checks.
Raw numbers are only helpful if the team can interpret them. That’s why RBTs must know how to transform raw data into meaningful summaries.
Rate
Rate = Count ÷ Time
Example: 40 requests in 2 hours → 20 requests/hour.
Mean Duration
Mean duration = Total duration ÷ Number of episodes
Example: Episodes lasting 3, 5, and 2 minutes → (3+5+2) ÷ 3 = 3.33 minutes.
Percentage
Percentage = (Number correct ÷ Opportunities) × 100
Example: 16 correct out of 20 → 80%.
Common errors:
- Forgetting to record total opportunities (making percentage impossible)
- Reporting counts without time (rate becomes meaningless)
- Rounding incorrectly
Exam Reminders:
- Rate = frequency adjusted for time differences
- Mean duration helps compare variability
- Percent correct depends on both correct responses and opportunities
| Measure | Formula |
|---|---|
| Rate | Count ÷ Time |
| Mean Duration | Total ÷ Episodes |
| Percentage | (Correct ÷ Opportunities) × 100 |
A.7 – Identify Trends in Graphed Data
RBTs do not make treatment decisions, but they should be able to look at a graph and identify basic patterns to report to their BCBA.
Three key visual dimensions:
1. Trend
Is the data going up, down, or staying flat?
2. Level
How high or low the data points are relative to each other.
3. Variability
Are the points clustered or scattered?
Examples of trends:
- Upward trend → behavior increasing
- Downward trend → behavior decreasing
- Flat trend → no meaningful change
- High variability → unpredictable behavior; may indicate inconsistent implementation
Importance of context
If a huge behavior spike occurs, consider:
- Illness
- Schedule changes
- Sleep issues
- Reinforcement changes
- Environmental disruptions
Common errors:
- Overreacting to one unusual data point
- Confusing variability with level changes
| Dimension | What to Look For |
|---|---|
| Trend | Upward, downward, flat |
| Level | Overall height of data |
| Variability | Stability vs scatter |
A.8 – Risks of Unreliable Data & Poor Fidelity
Accurate data means accurate decisions. When data is unreliable or procedures are not implemented correctly, several risks arise:
1. Misleading treatment decisions
Incorrect data may:
- Make an intervention appear effective when it’s not
- Cause the team to continue strategies that don’t work
- Lead the team to end an intervention prematurely
2. Ethical concerns
Inaccurate data violates ethical obligations. It can:
- Waste client time
- Reduce trust with families
- Harm client progress
3. Loss of treatment integrity
Procedural drift means the team isn’t implementing the plan as written. Without fidelity:
- Results become inconsistent
- Data stops reflecting true behavior
- BCBA cannot make evidence-based decisions
How to maintain high data quality
- Follow the written protocol precisely
- Ask questions when unsure
- Use objective definitions
- Choose appropriate measurement systems
- Enter data immediately after sessions
- Participate in integrity checks
- Accept corrective feedback professionally
| Risk Area | Impact |
|---|---|
| Decision Making | Ineffective interventions |
| Ethics | Client harm, lost trust |
| Fidelity | Inconsistent outcomes |
What Changed in Task List 3.0?
Topics that stayed the same:
- A.1 Continuous measurement
- A.2 Discontinuous measurement
- A.3 Permanent product recording
- A.4 Enter data and graph
- A.5 Describe behavior/environment
Topic removed:
- Preparing for data collection (still important, but no longer its own task)
Expanded topics:
- A.6 Summaries and calculations
- A.7 Trend identification
- A.8 Risks of poor fidelity
Why the changes?
The updated task list reflects a stronger emphasis on:
- High-quality data
- Accurate decision-making
- Visual interpretation
- Ethical implementation
The goal is to ensure RBTs can collect, understand, and report data in ways that directly support treatment teams.
| Area | Task List 2.0 | Task List 3.0 |
|---|---|---|
| Measurement | Included | Expanded |
| Graphing | Included | Emphasized |
| Data Prep | Separate task | Removed |
| Trend Analysis | Limited | Expanded |
| Ethics & Fidelity | Basic | Strong emphasis |
Leveraging Technology for Efficient RBT Data Collection
Technology holds a significant role in contemporary ABA practice by enhancing the efficiency of data collection and graphing for RBTs. Tools such as mobile applications, timers, and software programs, enable RBTs to document session-by-session tracking in real-time to reduce measurement error and risk.
Rather than depend solely on paper charts, RBTs can utilize behavior recording tools to accurately track behavior in terms of frequency, duration, latency, and Inter-Response Time (IRT). These recording tools will automatically calculate the rate and percentage of behaviors, generate graphs, and alert RBTs of inconsistencies in their data that may signal data drift or observer bias.
Additionally, technology improves the efficiency of visual analysis ABA to enhance RBTs ability to swiftly analyze trend direction, shifts in level, and to describe variability.
For instance, applications that generate line graphs can easily demonstrate an increase in the frequency of a behavior or show improvement over time from the baseline vs intervention phases.
Technology can also reduce time for supervisors to evaluate progress easily. For example, in addition to features that find treatment integrity checks to ensure procedural fidelity in ABA is present, technology could reduce RBT checks that would require some time during busy sessions.
Incorporating technology in their practice optimizes the RBT’s time to create reliable measurement and produces more accurate, interpretable summarized data sets.
Technology enhances RBT efficiency in:
- Real-time session-by-session tracking
- Reducing measurement errors and risk
- Generating ABA line graphs automatically
- Highlighting data drift or observer bias
Applications track frequency, duration, latency, IRT, and produce summarized data sets for supervisors. This streamlines fidelity monitoring and ensures accurate behavior trend analysis.
| Feature | Benefit |
|---|---|
| Real-time tracking | Fewer errors |
| Auto calculations | Faster summaries |
| Graph generation | Easier visual analysis |
| Alerts | Detect data drift |
| Fidelity checks | Improve integrity |
Next Steps
Ready to evaluate your understanding?
Take the 2026 RBT Data Collection & Graphing Quiz to check your mastery of these concepts. If you’re studying older material, the 2025 version is still available as well.
Faqs
How to prepare for data collection in RBT?
Prepare by learning operational definitions, selecting the right measurement system, and practicing accurate continuous vs discontinuous measurement methods.
How does RBT collect data?
RBTs collect data by observing behavior, recording frequency, duration, latency, or using permanent product in ABA, and updating graphs consistently.
How many questions is the RBT exam 2025?
The RBT exam typically includes 75 multiple-choice questions covering all Task List 2.0 content.
What are data points on a graph RBT?
Data points represent individual observations or session-by-session tracking on ABA line graphs showing behavior over time.
What is the role of the RBT in relation to data collection and display?
RBTs ensure accurate behavior recording, maintain procedural fidelity in ABA, summarize data, and update graphs for evidence-based ABA practice.